Debugging D3D12 fences & queues
Welcome to a hands-on session with DirectX 12. I was recently made aware by Christian of a synchronization problem in my D3D12 sample which required multiple tries to fix (thanks again for reporting this!). The more interesting part is however how to find it without doing a very close code review like Christian did, but by using some tools.
The setup
If you want to follow along, make sure to check out the repository at revision 131a28cf0af5. I don’t want to give away too much in one go, so we’ll assume right now there is some synchronization issue and we’ll debug it step-by-step. Let’s start with taking a look using the Visual Studio Graphics Diagnostics. For this, you need to install the Graphics Tools in Windows 10 – Visual Studio should prompt you to get them when you start the graphics debugging.
Without further ado, let’s start the GPU usage analysis. You can find it under “Debug”, “Start diagnostic tools without debugging”, “GPU Usage”. After the application ends, you should see something like this:
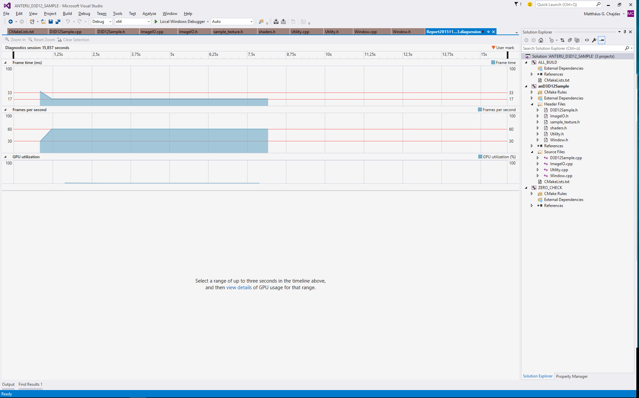
Let’s select a second or so and use the “view details” button on this. The view you’ll get should be roughly similar to the output below.
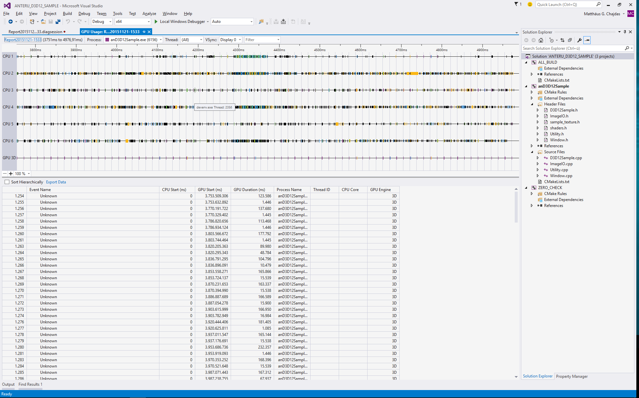
That’s a lot of things going on. To find our application, just click on one of the entries in the table below, and you should find which blocks belong to our application. In my case, I get something like this:

Ok, so what do we see here? Well, the CPU starts after the GPU finishes, with some delay. Also, the GPU 3D queue is very empty, which is not surprising as my GPU is not really taxed with rendering a single triangle :) Due to the fact that we’re running VSync’ed, we’d expect to be waiting for the last queued frame to finish before the CPU can queue another frame.
Let’s try to look at the very first frame:

Looks like the CPU side is only tracked after the first submission, but what is suspicious is that the GPU frame time looks like a single frame was rendered before the CPU was invoked again. We’d expect the CPU side to queue up three frames though, so the first frame time should be actually three times as long. Can we get a better understanding of what’s happening?
GPUView
Yes, we can, but we’ll need another tool for this - GPUView. GPUView is a front-end for ETW, the built-in Windows event tracing, and it hasn’t gotten much love. To get it, you need to install the “Windows Performance Toolkit”. Also, if you use a non-US locale, you need to prepare an user account with en_US as the locale or it won’t work. Let’s assume you have everything ready, here’s the 1 minute guide to use it:
- Fire up an administrator command prompt
- Go to
C:\Program Files (x86)\Windows Kits\10\Windows Performance Toolkit\gpuview - Run your application
- type in
log m, Alt+Tab to your application - Let it run a second or two, Alt+Tab back, and type
log - Run GPUView on the
Merged.etlfile.
Just like in the Visual Studio graphics analysis tool, you’ll need to select a few milliseconds worth of time before you can make any use of the output. I zoomed in on three frames here.
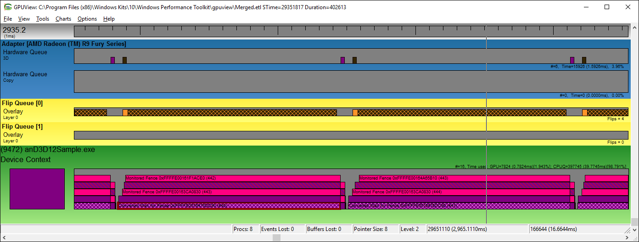
Notice the color coding for each application is random, so here my sample got dark purple. We can see it executing on the 3D queue, and at the bottom, we see the CPU submission queue.
You’ll notice that suspiciously, just while the GPU is busy, the CPU queue is completely empty. That doesn’t seem right - we should have several frames queued up, and the moment the GPU starts working (this is right after the VSync, after all!), we should be queuing up another frame.
Let’s take a look at the present function. Conceptually, it does:
- Call present
- Advance to the next buffer
- Signal a fence for the current buffer
At the next frame start, we’ll wait for the buffer associated with the current queue slot, which happens to be the slot we just used! This means we’re waiting for the last frame to finish before we issue a new one, draining the CPU queue, and that’s what we see in the GPUView output. Problem found! Fortunately, it’s a simple one, as the only thing we need to change is to wait for the right fence. Let’s fix this (and also the initial fence values, while we’re at it) and check again with GPUView.
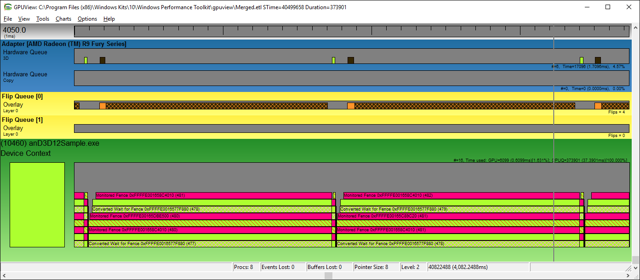
Looks better, we see a present packet queued and some data after it. Let’s zoom really close on what happens during the rendering.
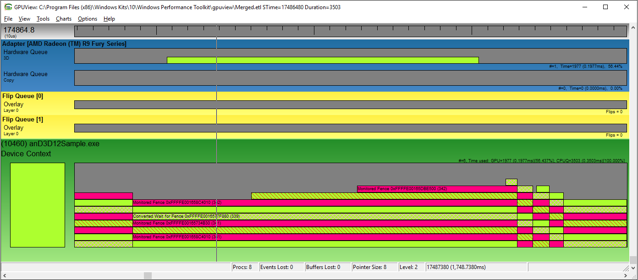
What do we have here? Two present packets queued up, while the GPU is processing the frame. Here we can also see how long it takes to queue up and submit the data to the GPU. Notice that the total time span we’re looking at here is in the order of 0.5 ms!
So finally, we fixed the problem and verified the GPU is no longer going idle but instead, the CPU queue is always nicely filled. While in this example, we’re limited by VSync, in general you always want to keep the GPU 100% busy which requires you to have one more frame worth of work queued up. Otherwise, the GPU will wait for the CPU and vice versa, and even a wait of 1 ms on a modern GPU is something in the order of 10 billion FLOPs wasted (in my example, on an AMD Fury X, we’re talking about 8601600000 FLOPs per ms!) That’s a lot of compute power you really want to throw at your frame :)
