Live OpenCL application profiling with AMD's GPUPerfAPI
Ever wanted to know what the actual performance of your OpenCL application is? Estimating memory bandwidth by guessing the number of bytes your kernel reads and writes and dividing this by the overall time? Trying to get a grip on cache behaviour?
If you answered any of these questions with yes, then this blog post is for you. I’m going to explain how you can add live profiling to your application using AMD’s GPUPerfAPI, which will allow you to tune and profile your API at the same time; and with hot-loading of OpenCL kernels, potentially for the fastest update-profile loop you’ve ever seen.
Background
On the GPU, estimating performance is just as hard as an CPUs. For instance, GPUs come with multiple caches and complex memory controllers, making it really hard to actually estimate how much data has to be read to execute a kernel. I’ve been recently helping out instrumenting a complex numerical solver at work, and it turned out that total memory bandwidth estimation was off by a factor of 10. It’s not because the computation was very sloppy, but because the actual cache hit rates and cache effects are very hard to estimate without resorting to extremely complex (and slow) simulators, which are often not feasible at all for the very large data sets you want to process on a GPU.
Fortunately, the hardware can help us in this situation. Modern GPUs have hardware performance counters, similar to CPUs, which allow for precise measurement. Typically, these are not exposed (or only to IHV specific tools), but at least on AMD, you can in fact read them using the excellent GPUPerfAPI library. Hardware performance counters are also interesting because they are nearly zero overhead and they require no changes to your code, which makes them non-intrusive.
The GPUPerfAPI provides access to the hardware counters for any application. For example, with this API, you can read:
- FetchSize: The amount of data actually read from GDDR memory by the kernel. This is the amount of bandwidth your kernel required, which can be drastically lower than the estimated number due to caching.
- CacheHit: The cache hit rate.
- VALUUtilization: The coherency in the vector unit.
With these values alone, you can already get a very precise understanding how effective your kernel is. Besides those three, the API provides lots of additional counters; check out the documentation for details.
Getting started
The GPUPerfAPI is available for both Windows and Linux. On Windows, you can use it to profile OpenCL, OpenGL, Direct3D 10 and 11, and on Linux, for OpenCL & OpenGL. Initialization is a bit tricky, as there is no static library to link against (and you wouldn’t want to link against one anyway.)
What I did is to write a simple wrapper, which opens the DLL/SO and then dynamically loads each function. This is very easy to do, in fact, there is a special function types header which contains all the function type definitions, which are otherwise pretty tedious to write. You can find a drop of my current wrapper library at github.com/anteru. As of today, it’s pretty basic and likely to contain a few bugs, but it should give you a good starting point nonetheless. Before you can do anything with the API, you have to initialize it by calling GPA_Initialize followed by GPA_OpenContext. For OpenCL, simply pass the command queue to GPA_OpenContext. Now you are ready to go.
Profiling itself consists of three steps:
- Querying and enabling counters
- Gathering data
- Retrieving results
To query the available counters, you first have to get the number of available counters using GPA_GetNumCounters. You can then enumerate and query them using GPA_GetCounterName, GPA_GetCounterDataType and so forth. Once you have found the counters you’d like to read, enable them using GPA_EnableCounter (which takes and index into the initial counter list) or GPA_EnableCounterStr (which accepts the counter name.)
You’re now set to query data. Depending on how many counters you have activated, you might need multiple passes (i.e., multiple kernel executions) to read them all. Once enabled, call GPA_GetPassCount to get the number of passes. Gathering results itself is straightforward:
- Call
GPA_BeginSessionto start a profile section. Save the session id to retrieve the results of this section later. -
For each pass:
- Call
GPA_BeginPass - Call
GPA_BeginSample– you can have more than one sample per pass; for my current code, I simply use a single sample, always. - Run your kernel
- Call
GPA_EndSample,GPA_EndPass
- Call
-
Call
GPA_EndSession
Now the results are somewhere, but not on the CPU yet. If you want to get maximum profiling efficiency, you can run multiple profile sessions before you start fetching the results. To query if the results are ready, use GPA_IsSessionReady; I have a blocking version of this in my code which simply calls it in a loop until results are ready.
Once you have the results, you have to re-associate them with the counters. This is straightforward as well:
- Get the number of active counters using
GPA_GetEnabledCount - Enumerate them and query the original index of the counter using
GPA_GetEnabledIndex - You can now query the counter details again using
GPA_GetCounterName, etc., or you just store the indices from the first enumeration and map them now - Retrieve the data using
GPA_GetSampleUInt32,GPA_GetSampleUInt64,GPA_GetSampleFloat32,GPA_GetSampleFloat64
And that’s it!
Results
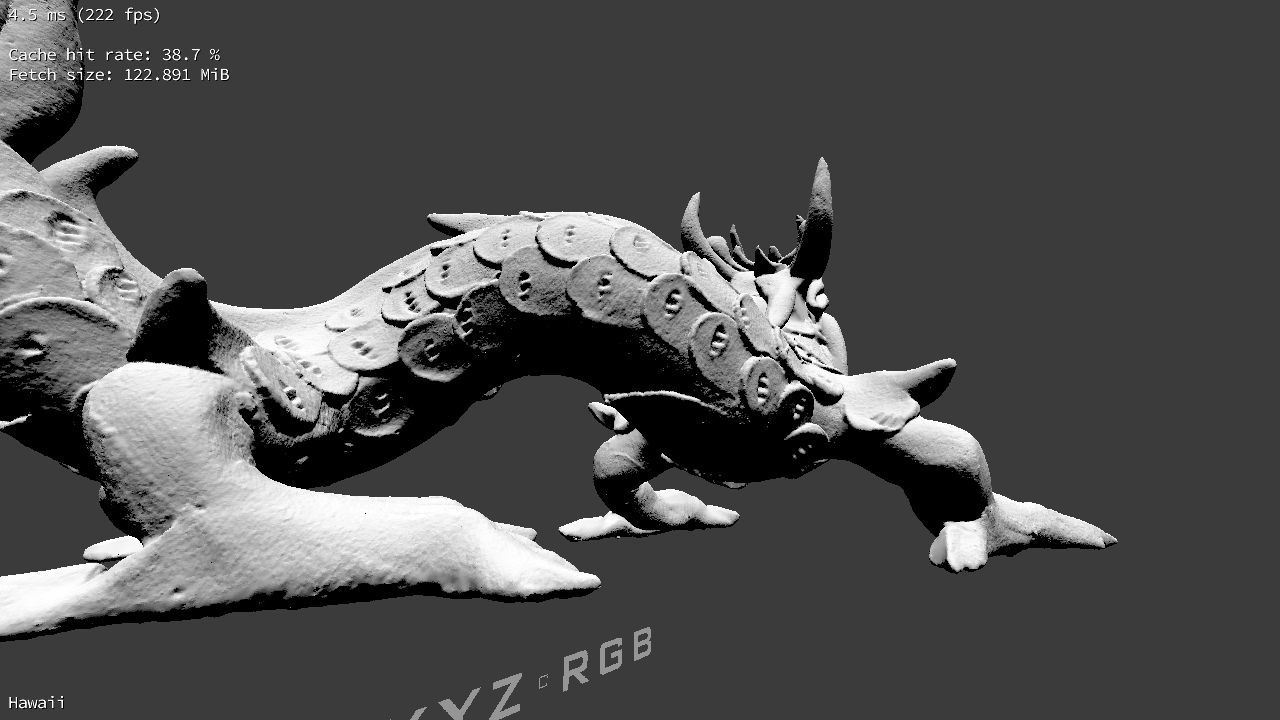
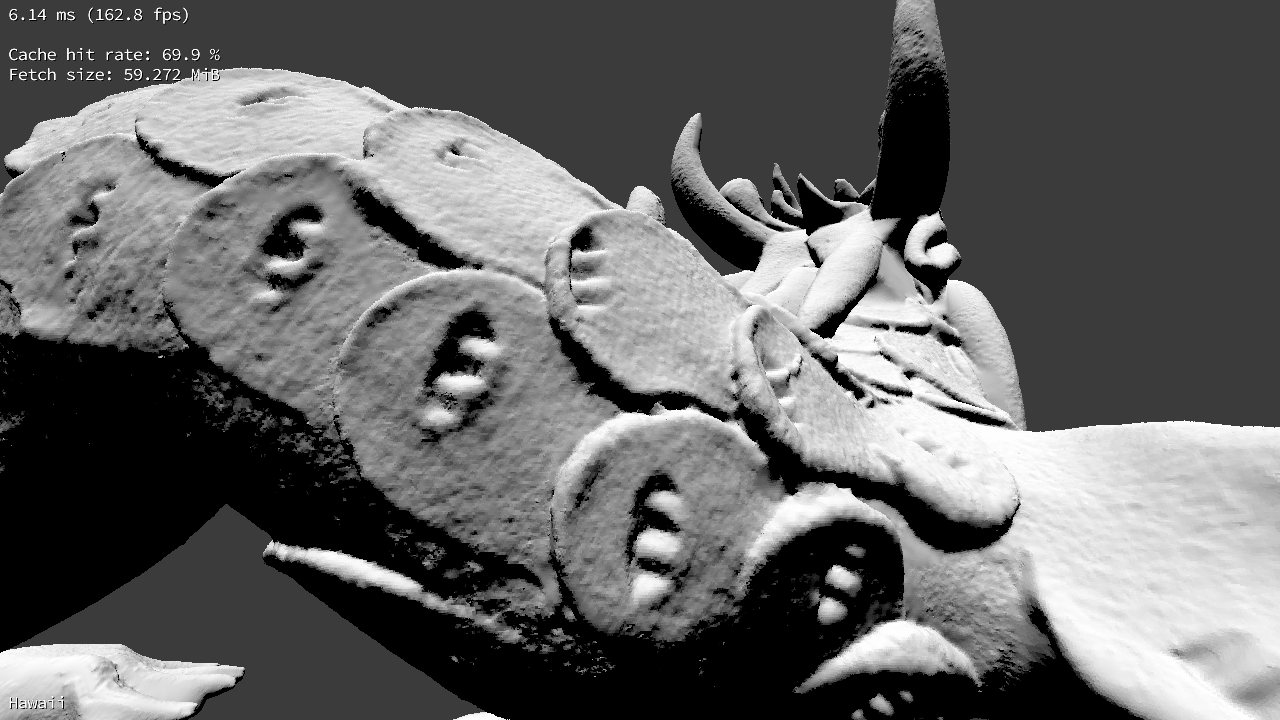
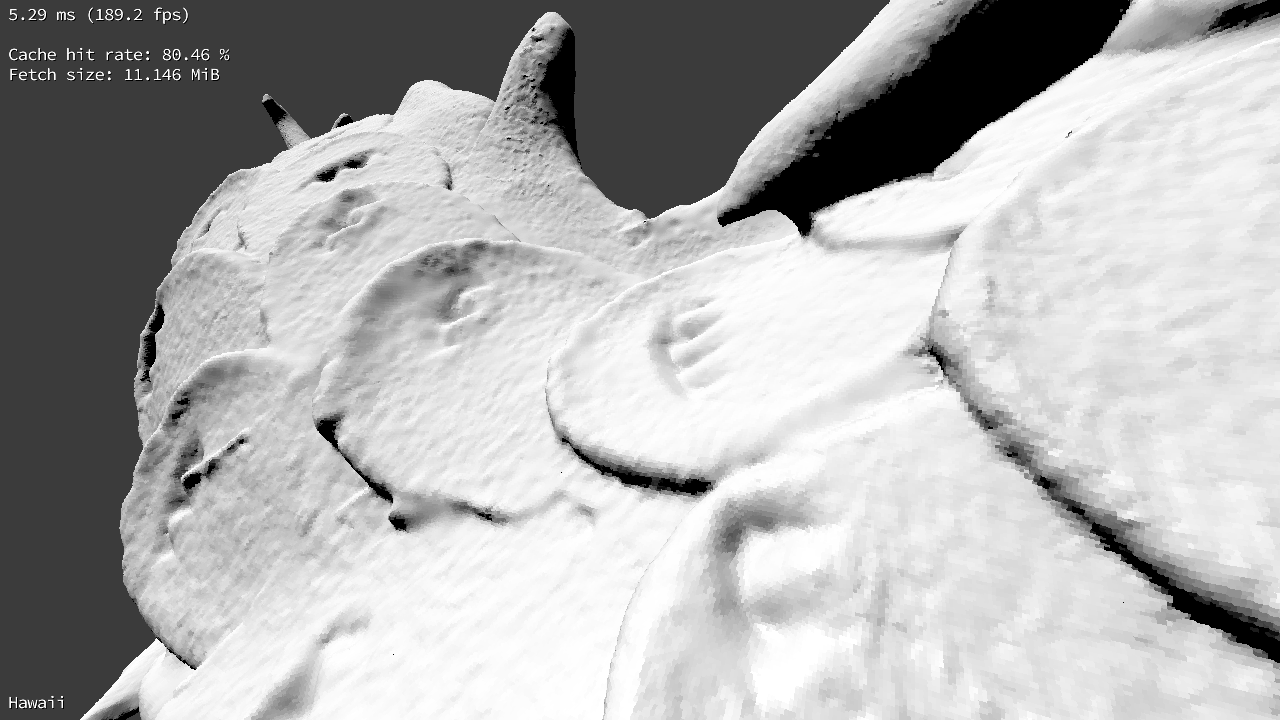
Here are a few results from my ray-tracer. I’ve been measuring the cache hit rate as well as the amount of data that needs to be read for each frame. You can see it in the top-left corner. Having this data “on screen” is much more useful than running it in CodeXL and having it available post-run only, as I can now immediately correlate it with a particular view and experiment.


This is pretty amazing, as for the first time, I can actually get precise readings from the hardware for data which is otherwise very hard to obtain. I’ve written a SIMD simulator to guess the numbers you can see above, but an error of 50% is normal for a simulator compared to the real hardware data.
The profiling is also nearly without overhead, as you can see above, the rendering including profiling runs in less than 5 ms per frame. It’s a no-brainer to add to any existing OpenCL application, and if you’re serious about performance, you should integrate this right away – you’ll be amazed what the actual cache hit and coherency rates are!
Note for HD 7970 users and Catalyst 14.4
If you are using a Southern Islands card (7970 and similar), there is a known issue with the 14.4 Catalyst which will send you straight to blue-screen county. Just downgrade to a previous driver or wait for a future one. On newer hardware (R9 290), everything works fine. I ran into this issue when trying out the API initially :) Thanks Chris!
Update: The issue has been resolved, with the Catalyst 14.6, everything works as expected again on the HD 7970.
